
BPCL Valuation, Part 3: What Is BPCL’s Cost of Capital?
The return BPCL must earn to create value


In Part 1, we crafted a detailed 10-year forecast for BPCL’s major segments: refining, fuel marketing, petrochemicals, and green energy. In Part 2, we estimated the reinvestment needed for growth and whether those investments will outpace BPCL’s cost of capital. Now, in Part 3, we dive into the core of valuation: how do we discount future cash flows to determine BPCL’s true worth today?
Here’s what’s ahead:
Calculating BPCL’s WACC: We’ll use the CAPM to estimate the cost of equity, analyze borrowing costs for the cost of debt, and weigh them by BPCL’s capital structure.
India-Specific Assumptions: We’ll incorporate the latest 10-year G-sec yield, Damodaran’s equity risk premium, India’s country risk, and BPCL’s beta, adjusted for government ownership and industry dynamics.
Full DCF Model: Using segment forecasts from Parts 1 and 2, we’ll project Free Cash Flow to the Firm (FCFF) over 10 years and calculate terminal value with the Gordon Growth model and exit multiples.
Downloadable Excel Model: Get a clean, editable spreadsheet with all inputs and assumptions to test your own scenarios.
Part 3: Cost of Capital Estimation (WACC)
To understand how we determine the value of BPCL, we need to "discount" its future cash flows i.e. essentially, calculate their present value by accounting for the time value of money and the risks involved. I am assuming you already understand the concept of ‘time value of money’ so I won’t discuss it here (DM me in case you don’t know).
For this, we use a key financial metric called the Weighted Average Cost of Capital or WACC. Think of WACC as the overall "price" a company pays to get the money it needs to operate, blending together the cost of funds it gets from shareholders (called equity) and the cost of money it borrows (called debt). The idea is to figure out this average cost based on how much the company relies on each source i.e. equity versus debt.
The simple theory behind it is this: The cost of equity is what shareholders expect to earn for investing their money, reflecting the risk they take. The cost of debt is the interest the company pays on its loans, but since interest can lower taxes, we adjust that cost to account for the tax savings.
The WACC then balances these two costs according to the company’s mix of equity and debt. For eg, if a company uses more equity, the shareholders’ expectations weigh more, while more debt brings in the lenders’ interest costs. This blended rate (which is the WACC) tells us the minimum return the company needs to make to keep both its investors and lenders happy. We use this number to estimate the value of the company’s future earnings by figuring out what those earnings are worth today.
Here’s a quick mind map of what we will be covering below:

Let’s break down WACC step by step to make it clear.
Breaking Down the Components of WACC
First, Cost of Equity (Ke)
The cost of equity represents the return that investors expect for investing in BPCL’s stock, considering the risk they take. We calculate this using the Capital Asset Pricing Model (CAPM).
The formula is simple:
Ke = Rf + β * ERP
Let’s understand what each component of cost of equity means and how it is derived:
1. Rf (Risk-Free Rate):
This is the return on a risk-free investment, like a government bond. For BPCL, we use 4.11%, which comes from the yield on a 10-year Government of India (GoI) bond (6.50%) adjusted by India’s default spread (2.39%). The default spread reflects the extra risk of investing in India compared to a perfectly safe country like the US. So, 6.50% minus 2.39% gives us 4.11%, a safer baseline rate for Indian conditions.

2. β (Beta):
This measures how volatile BPCL’s stock is compared to the overall market. A beta of 1.26 means BPCL’s stock tends to move 26% more than the market, reflecting its sensitivity to oil price swings and government influence.
How did we arrive at 1.26? First, it may help to understand what bottom-up beta is, and why it’s calculated the way it is.
The intuition behind bottom-up beta lies in breaking a company’s risk into two parts: (1) business risk (which is inherent to the entire oil and gas distribution industry) and (2) financial risk (unique to BPCL, due to its own debt).
The unlevered beta reflects the business risk of the industry, stripped of the effects of debt.
We then "re-lever" this beta using BPCL’s debt-to-equity ratio to account for the additional risk that debt introduces, as debt increases financial obligations and potential bankruptcy risk. This method ensures the beta aligns with BPCL’s specific circumstances while leveraging reliable industry data.
So, a bottom-up beta estimates a company’s risk by (1) looking at the average ‘unlevered’ beta of comparable companies within the same industry, and then (2) adjusting it for our company’s specific capital structure (debt and equity mix).
What’s ‘unlevered’ beta?
Imagine a company’s risk as a pie: part of it comes from the industry it operates in (e.g., oil price fluctuations), and part comes from how much debt it carries (which adds financial strain).
Unlevered beta slices out the debt portion, leaving only the industry risk.
For instance, if the oil/gas distribution industry has an unlevered beta of 0.8, it means companies engaged in oil and gas distribution are slightly less volatile than the market (beta of 1), due to stable demand, but still exposed to commodity risks.
This approach (of looking at the avg. unlevered beta of comparable companies and then adjusting it for BPCL’s capital structure) is particularly useful when historical stock data might be noisy or unrepresentative i.e. for the likes of BPCL, where government ownership and oil price volatility could skew regression results. It provides a forward-looking, fundamental view of risk based on industry norms and the company’s financial leverage.
Bottom-Up Beta Computation
The formula to compute the levered (or re-levered) beta from an unlevered beta is:
Levered Beta of BPCL (β_L) = β_U * [1 + (1 - T) * (D/E)]
Where:
β_L = Levered beta (the final beta for BPCL).
β_U = Unlevered beta (oil and gas distribution industry average, adjusted for cash).
T = Marginal tax rate (assumed 25% based on prior context, as it affects the tax shield of debt).
D/E = Debt-to-equity ratio (which is 0.76 for BPCL).
Step-by-Step Calculation
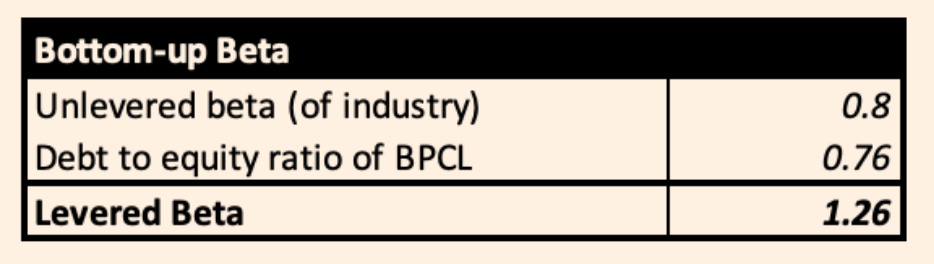
Unlevered Beta (β_U):
According to Damodaran’s annual data, the global oil/gas distribution industry’s unlevered beta, corrected for cash, is 0.8. This value represents the inherent business risk of oil and gas distribution companies worldwide, adjusted to remove the effect of cash holdings that reduce risk.Debt-to-Equity Ratio (D/E):
BPCL’s D/E ratio is provided as 0.76. This means for every ₹1 of equity, BPCL has ₹0.76 of debt, indicating a moderate level of leverage.Tax Rate (T):
We use a marginal tax rate of 25%, consistent with Indian corporate tax rates mentioned earlier, which provides a tax shield on interest payments.Re-Levering the Beta:
Plugging into the formula:
β_L = 0.8 * [1 + (1 - 0.25) * 0.76]First, calculate the tax-adjusted leverage: (1 - 0.25) * 0.76 = 0.75 * 0.76 = 0.57.
Then add 1: 1 + 0.57 = 1.57.
Multiply by the unlevered beta: 0.8 * 1.57 ≈ 1.256.
So, the bottom-up levered beta for BPCL is approximately 1.26.
Intuition and Logic
The unlevered beta (0.8) starts with the industry’s baseline risk, assuming no debt. Oil and gas distribution is somewhat stable due to consistent demand, but it’s still exposed to commodity price swings, justifying a beta slightly below 1.
The term (1 - T) * (D/E) adds the financial risk from debt. The tax shield (1 - T) reduces the effective cost of debt, as interest is tax-deductible, making leverage less risky. Here, 0.76 D/E suggests BPCL uses debt moderately, increasing its risk from 0.8 to 1.26.
The result, 1.26, indicates BPCL’s stock is 26% more volatile than the market, reflecting both its industry risk and its leveraged structure. This aligns with the intuition that government support might lower volatility slightly, but debt and oil price exposure push it above 1.
This bottom-up beta of 1.26 can now be used in the CAPM formula (Ke = Rf + β * ERP) to refine BPCL’s cost of equity.
3. ERP (Equity Risk Premium):
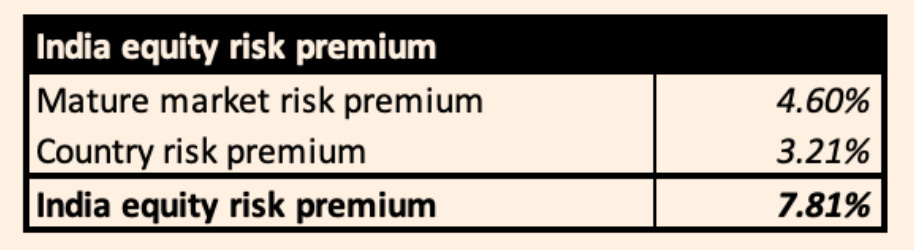
This is the extra return investors demand for investing in stocks over a risk-free asset. For India, we start by taking a mature market premium (around 4.60% for US, which is a developed market) and add India’s country risk premium (which is 3.21%, due to its economic and political risks).
Together, this gives us 7.81%, which we’ll use as the ERP.
Plugging these into the Cost of Equity formula: Ke = 4.11% + 1.26 * 7.81% ≈ 13.95%.
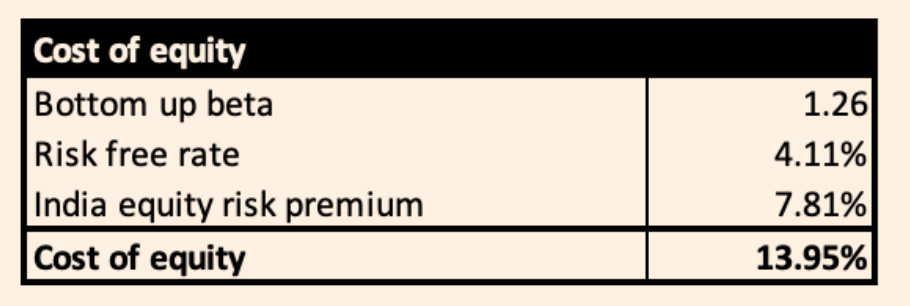
This 13.95% is the estimated cost of equity, meaning investors expect a return of about 13.95% on their investment in BPCL to compensate for the risk.
Why This Matters
The cost of equity is crucial because it reflects what shareholders demand, influenced by BPCL’s industry (oil and gas, which can be cyclical) and its government backing (which adds stability but also policy risks).
Now that we have cost of equity, let’s calculate the
Cost of Debt (Kd):
BPCL is rated AAA (domestic), reflecting strong government backing and financial flexibility. We assume its pre-tax cost of debt is 12.00% (this is reasonable and conservative for most Indian listed companies).
Given the marginal tax rate of 25.0%, the after-tax Kd ≈ 12.00% * (1 - 0.25) = 9.00%.

Tax Rate: Corporate tax rate for BPCL is ~25.0% (as per the provided marginal tax rate).
So after-tax Kd ≈ 9.00%.
Capital Structure
We use market value weights. The market value of equity is Rs. 121240 crores, and interest-bearing debt is 58880.00, totaling a capital of Rs. 180120 crores. This suggests a weight of equity at 67.3% and debt at 32.7%.
It’s worth noting BPCL’s debt might rise with the capex plans. By FY2027, if it takes significant loans for Bina and other projects, debt could increase. However, since we are doing a DCF as of today, we’ll use the current structure. If anything, using current weights (which are equity-heavy) may slightly understate WACC if BPCL indeed leverages more (since debt is cheaper). But PSU OMCs tend to maintain moderate leverage thanks to government support and high working capital financing needs that they can refinance.
WACC calculation
WACC = E% * Ke + D% * Kd (1 - T)
E%: This is the percentage of the company’s total value that comes from equity (shareholders’ money). For example, if 67.3% of BPCL’s value is from equity, that’s E%. It shows how much weight equity has in the mix.
Ke: This is the cost of equity, or the return shareholders expect for investing in the company (e.g., 13.95% for BPCL). It’s like the "interest" shareholders want.
D%: This is the percentage of the company’s total value that comes from debt (borrowed money). If 32.7% is from debt, that’s D%. It shows debt’s weight in the mix.
Kd: This is the cost of debt, or the interest rate the company pays on its loans (e.g., 9.00% for BPCL after taxes). It’s the "interest" lenders charge.
(1 - T): This adjusts the cost of debt for taxes. Since interest on debt is tax-deductible, the company saves some money on taxes. If the tax rate (T) is 25%, then (1 - 0.25) = 0.75, meaning the effective cost of debt is reduced by 25%.
How It Works
Multiply the equity percentage (E%) by the cost of equity (Ke) to see how much equity contributes to the total cost.
Multiply the debt percentage (D%) by the after-tax cost of debt [Kd * (1 - T)] to see how much debt contributes.
Add these two amounts together to get the WACC, which is the overall average cost of capital.
Plugging in:
Equity weight ~67.3%, Ke ~13.95% Debt weight ~32.7%, Kd (after tax) ~9.00% WACC ≈ 0.673 * 13.95% + 0.327 * 9.00% = 9.23% + 2.94% = 12.17% (rounded to 12.3%).
We will use ~12.3% nominal INR WACC as our base discount rate.

This rate may appear slightly high; some might argue for a lower WACC because of government ownership (which lowers default risk and perhaps the required return).
However, it also carries some political risk which private firms don’t have, justifying a somewhat higher equity risk. Also, the 12.3% reflects a equity-heavy structure – BPCL could finance more with debt given its AAA rating, which would lower WACC. For instance, if BPCL moves to 50:50 D/E in coming years (to fund expansions), WACC might drop to ~9-10%.
Recent Developments (Bonus Issue, etc.): BPCL had a 1:1 bonus share issue in FY2024, doubling the number of shares. This doesn’t affect market cap or WACC per se, but it halves the per-share intrinsic value (since share count doubled). We will be careful to compute the intrinsic value per share based on the post-bonus share count (which is 434 crores shares).
Current share price is around ₹280-290 post-bonus. The market cap Rs. 121240 crores reflects this new share count.
Summary: Base case Cost of Equity ~13.95%, Cost of Debt ~9 % (after-tax), producing WACC ~12.3%. We will use 12.3% in our DCF. We will also evaluate a lower WACC scenario (~11.2%) and higher (~13.2%) to cover uncertainty in risk premia. (Note: All rates are nominal INR. Indian inflation is implicitly accounted for in cash flows growth and WACC. If we were doing real WACC, we’d use a real RF ~2% and remove inflation from growth, but we stick to nominal.)
You may download the entire Excel model, including revenue and EBIT model, capex schedule, as well as cost of capital schedule below: