


What’s BPCL Really Worth? (Part 1: Revenue, Segments, and Forecasts)
A full-stack, segment-wise DCF model covering refining, marketing, petrochemicals, and green energy — the first in our weekly company valuation series

Welcome to a new deep-dive research series where I will analyze and value one listed Indian company each week, from first principles.
Every valuation will be backed by:
Segment-wise revenue and profit forecasts
Capital reinvestment modeling
Cost of capital and discount rate calculations
Intrinsic value estimation using DCF
Bull, base, and bear case scenarios
A downloadable Excel model for your own use
This week, we begin with BPCL (Bharat Petroleum Corporation Limited), a legacy oil marketing company that’s reinventing itself as an integrated energy powerhouse.

Part 1: Segment-Wise Revenue and EBIT Forecast
In this issue, we focus on building BPCL’s 10-year revenue and EBIT projection, across all four of its core business segments:
Refining Segment
Forecasts throughput rising from 37 MMT in FY25 to 46 MMT by FY34
Revenue linked to Brent crude prices ($70–75/barrel assumed) and rupee depreciation
EBIT margins derived from GRMs and operating cost assumptions — expected to stabilize around 4–5%
Fuel Marketing (Retail) Segment
Sales volume projected to grow from 52 to 61 MMT
Per-litre margin assumed at ₹2.5, translating to ~4–5% EBIT margin on an average price of ₹50–60/litre
Revenues modeled on per-ton price and volume, with strong growth from diesel and LPG demand
Petrochemicals Segment
Kochi PDPP and Bina Cracker expansion modeled in detail
Sales volume projected to grow from 0.3 MMT to ~3 MMT
Product pricing based on propylene and polymer benchmarks (₹80,000–90,000 per ton)
Revenue expected to rise from ₹24,000 Cr to ₹2.6 lakh Cr, with segment margins around 15%
Green Energy Segment
Renewable electricity generation forecast to scale from 200 GWh to 7,000 GWh
Average tariff modeled at ₹3.5–₹4.0/kWh
Revenue estimated to grow from ₹70 Cr to ₹2,800 Cr over 10 years
Captures EV charging, biofuels, and early green hydrogen rollout
Each assumption is grounded in operational disclosures, project timelines, and market benchmarks (not guesswork).
What’s Coming Next
Part 2: Reinvestment and Capital Efficiency
We’ll model how much BPCL needs to reinvest to maintain and grow its business. Expect detailed estimates of capital expenditure by segment, analysis of capital turnover, and a forecast of return on invested capital (ROIC).
Part 3: Cost of Capital and Valuation
We’ll compute BPCL’s weighted average cost of capital (WACC) using real bond yields, market beta, and equity risk premiums. Then we’ll build a full DCF valuation and arrive at an intrinsic value per share — with a full bull/base/bear scenario matrix.
Part 4: Strategic and Qualitative Drivers
We’ll cover government ownership, policy risks, ESG credibility, and the company's role in India’s energy transition. Optionality in green hydrogen, EV infrastructure, and petrochemical exports will also be explored.
Bonus: A Fully Downloadable Excel Model
At the end of the series, you’ll receive a ready-to-use Excel valuation model that includes:
All key assumptions
Segment-wise revenue and EBIT drivers
FCFF and terminal value calculations (only in Part 4)
Now… before we proceed with valuing BPCL, it’s important to try to remember that financial models are only as important as the story they tell. That is to say that numbers alone do not explain why a company will grow, how it will maintain margins, or what makes its business model sustainable. It’s important to understand the narrative behind the numbers (to borrow from the brilliant Aswath Damodaran) so we know precisely what the financial model is saying.
So, staying true to that principle, I first begin discussing BPCL’s story, which will help us answer questions like, “Why is its revenue growing? Why will margins expand despite policy risks? What will drive returns beyond the refining cycle?” Following this, we continue to value BPCL using practical assumptions and modelling.
Shall we begin?
Narrative behind the numbers
BPCL, as most of you may know, is one of India’s largest oil marketing companies (OMCs). It earns most of its revenue, almost 60%, by selling fuel through its retail outlets and nearly 38% from refining crude oil. But the company is also expanding into new areas such as petrochemicals (for now, 1-2% of revenues), renewable energy, and green hydrogen. This is part of its broader strategy to prepare for the future of energy and reduce its reliance on fossil fuels.
For instance, BPCL has planned a large investment of about Rs. 1.5 lakh crores over 5 years. This money is being spent to increase capacity, modernize infrastructure, and build new businesses that are better aligned with global trends in energy and sustainability.
Current capacity: Note that BPCL owns and operates 3 major refineries located in Mumbai, Kochi, and Bina. Together, these refineries process more than 35 million metric tonnes (MMT) of crude oil every year. The company has also been operating its refineries at more than full capacity in recent years. To increase this further, BPCL is expanding its Bina refinery recently (more on that later).
Refining segment: Assuming that crude oil prices remain around $70-75 per barrel, and that the INR weakens slightly over time, BPCL’s revenue from refining is expected to grow steadily. In 2025, refining revenue is projected to be about Rs. 1.6 lakh crores. By 2034, this figure could grow to around Rs. 2.4 lakh crores. This growth will happen not just because of changes in price, but also because the company will refine more crude oil in future years.
Fuel marketing segment: Then, BPCL also has a large and well-established fuel marketing network across India. The company operates more than 21,000 petrol pumps and serves lakhs of customers every day. Its sales volume is expected to increase from 52 MMT in 2025 to 61 MMT by 2034. Revenue from this segment is expected to grow from Rs 3 lakh crore to Rs 4.12 lakh crore over the same period.
BPCL’s marketing business is expected to maintain profit margins of about 4-5%. Because this business sells large volumes at many locations, it brings in steady cash flow and helps balance the ups and downs of refining.
Petrochemicals segment: Petrochemicals is another growth engine for BPCL. The company already operates a unit at its Kochi refinery that produces polypropylene, which is a type of plastic used in packaging and textiles. This unit is expected to operate at full capacity, producing about 0.3 MMT every year. The big leap, however, will come from a new petrochemical complex being built at the Bina refinery. Once it becomes operational around 2029, this facility will produce up to 3 MMT of petrochemicals every year. These products will include plastics and other materials used in everyday life, such as in pipes, containers, and automobile parts.
BPCL’s revenue from petrochemicals is expected to grow from Rs 2400 crores in 2025 to over Rs 26100 crores by 2034. This part of the business is also expected to earn higher profit margins compared to refining or marketing.
Green energy segment: And finally, we have the green energy segment. BPCL has been investing in renewable energy sources such as solar and wind power. The company plans to generate electricity from these sources and sell it to the grid or to industrial users. BPCL is also setting up green hydrogen production plants at its refineries and aims to expand into electric vehicle charging across the country. In 2025, for instance, BPCL’s green energy business is expected to generate about Rs 70 crores in revenue. This number could grow to Rs. 2,800 crores by 2034. Over time, I do believe green energy has the potential to become an important source of income for the company (but we’re talking over a very longer time period).
Capex: BPCL’s planned capital expenditure is front-loaded. This means the company will invest heavily in the first few years, mainly in the Bina refinery expansion and green projects. About Rs. 88,500 crores are expected to be spent between 2025 and 2028. After that, the company expects its return on invested capital to improve significantly, especially as petrochemical revenue begins to grow.
By 2030, BPCL is expected to earn a return of around 10% on its investments. This would be higher than its cost of capital, which is estimated to be 8.8 percent (see the valuation model below). This suggests that BPCL will be creating value for shareholders after a period of building and reinvesting.
Intrinsic Valuation of BPCL
Part 1: Revenue and EBIT Forecast Schedule
Segmentation of Businesses: We first begin with forecasting BPCL’s revenue and EBIT or operating margin for the next 10 years.
As mentioned earlier, BPCL’s operations are segmented into 4 key areas for forecasting: (a) Refining, (b) Marketing (Fuel Retail), (c) Petrochemicals, and (d) Green Energy. I build a 10-year forecast (FY2025–FY2034) for each segment’s volumes, price realisation (linked to Brent crude in USD), and EBIT margins.
Key assumptions (Brent crude price path, USD/INR rate, growth in volumes, etc.) are detailed for each segment, and all calculations are shown step-by-step in tables. Historical performance (e.g. EBIT margins, Gross Refining Margins) and peer benchmarks are incorporated to ground the forecasts.
(a) Refining Segment Forecast
Volume (Throughput): BPCL has a refining capacity of 35.3 MMTPA (million tons per annum) as of FY2024, operating at over 100% utilization. In FY2024, BPCL’s refineries processed ~39 MMTPA (about 110% utilization, given 51 MMT sales including some purchased products) – for instance, in Q2 FY2025 alone throughput was10.28 MMT (114% of nameplate).
I assume BPCL sustains high utilization until new capacity comes online. A major expansion is underway: the Bina refinery is being expanded by +3 MMTPA by May 2028 (FY2029). I project refining throughput rising gradually from37 MMT in FY2025to45 MMT by FY2030 (once the new capacity is fully operational), then holding ~45–46 MMT through FY2034. This aligns with India’s outlook to add ~1 million barrels per day (bpd), which is equal to ≈50 MMTPA of refining capacity by 2030 to meet demand, with BPCL contributing via Bina and other projects.
Price Realization: I link BPCL’s refined product prices to Brent crude (in USD) as a base. The assumed Brent path (in real terms) is: $70/bbl in FY2025, dipping to $65 in FY2026, then rising gradually to $75 by FY2030 and holding around $75 thereafter.
I assume USD/INR = 85 in FY2025 (per actual) and a slight depreciation to ~95 by FY2034 (about 1% per year, reflecting inflation differentials). BPCL’s product slate typically trades near international prices, so for simplicity the refining segment’s revenue per barrel is taken as roughly equal to the Brent price (I assume product cracks offset refinery fuel loss and processing costs in the revenue to cost structure).
For example, in FY2025 Brent $70 with ₹85/$ implies an average realisation of ~₹5,950 per barrel of refined product. I add a modest uplift for product crack spreads in later years as demand improves – e.g. by FY2030 at $75 Brent, realisation ~₹6,750/bbl (assuming ~$5 average crack over Brent). These assumptions yield the revenue forecast shown below.
The table below presents the Refining segment forecast, including throughput, price assumptions, and revenue forecasts:

Note: Realization per barrel is derived from Brent price * FX, plus a small crack spread.
EBIT Margin: Refining EBIT margins are driven by the Gross Refining Margin (GRM) and operating costs.
Remember that BPCL earns money in its refining business through what is called the Gross Refining Margin (GRM). This is the difference between the price at which BPCL sells its fuel products and the cost of the crude oil it uses to make them.
For eg., if BPCL earns a GRM of $6-7 per barrel, and if the total selling price of fuel is around $70-75 per barrel, then the gross margin, which is the % of revenue left after just covering crude oil costs, is around 8-9%. That’s GRM.
Now… BPCL’s historical GRMs have been cyclical: it achieved a record GRM of $14.1/bbl in FY2024 (and even higher ~$20 in FY2023) thanks to favourable crude differentials and product cracks, far above the long-term normal. Product crack, in case you don’t know, is simply the difference between the selling price of a refined product (like petrol or diesel) and the price of crude oil used to produce it.
Mid-FY2025, however, the margins have reverted to cycle lows. BPCL’s April–Dec 2024 GRM, for instance, averaged just $5.95/bbl, down from $14.72 a year earlier as crack spreads normalised and inventory losses occurred.
For our financial model, I assume a normalised GRM of ~$6–7/bbl for the forecast, with improvement to ~$8 by FY2030 as the new petrochemical-integrated capacity boosts margins.
What’s the logic behind this assumption?
Note that BPCL’s refineries historically outperform the benchmark Singapore complex GRM by a small premium due to high distillate yields and ability to process cheaper crudes, so our GRM forecast assumes BPCL stays ~+$1/bbl above the Asian benchmark. A distillate yield, in case you don’t know, is the % of a barrel of raw crude oil that is converted into middle distillate products like diesel, jet fuel, and kerosene during refining.
Now… converting these margins to EBIT: On a GRM of $6–7, BPCL still has to pay for other operating costs (called refinery cash costs) to run the refinery. These include electricity, staff, maintenance, and chemicals. Industry averages suggest these costs are typically $2 to $3 per barrel. So from the $6 gross profit, if we subtract $2–3 in operating cost, we get net EBIT per barrel = $3 to $4. So EBIT margin is simply $3 divided by crude oil price of $75 = 4%. I hope this is clear.
Now, for our case, I will benchmark to global peers: complex refiners often see ~5–10% EBIT margins at mid-cycle, while simpler refineries or those in regulated markets are lower. I assume BPCL’s refining EBIT margin stabilizes around 5% in the long run (with near-term dips due to weaker GRM). This is reasonable given its scale and complexity – for example, PSU peers IOCL/HPCL had refining margins of a similar order historically (BPCL’s FY2022–24 GRMs were positive outliers, but those translated to volatile profits due to offsetting marketing losses).
The table below presents the Refining segment forecasts of EBIT (with margin%).
All figures are in ₹ crore except volume and prices:

Notes: EBIT margin reflects GRM minus operating costs.
In the base scenario, refining EBIT grows from ₹~5,648 Cr in FY2025 to ~₹11,132 Cr by FY2030 as throughput and margins both improve.
I factor in potential inventory gains/losses in margins: e.g. this year in FY2025 a drop in crude price from $80 to $70 could cause an inventory valuation loss (hence the margin dips to 3.5% in FY25), whereas stable or rising price environment in later years avoids such hits.
The complexity of BPCL’s refineries (ability to process high-sulphur crudes, as indicated by API range 27–52) supports its long-term margin staying healthy relative to simpler refiners. I cross-checked the terminal EBIT margin (~5%) with global/regional peers: Singapore benchmark refining margins are ~ $5 (long-term), and integrated refiners typically achieve mid-single-digit percentage margins – my forecast aligns with these benchmarks.
(b) Marketing (Fuel Retail) Segment Forecast
Volume (Sales): BPCL is India’s second-largest fuel retailer (OMC) with 51.04 MMT of domestic product sales in FY2024 – its highest ever, giving ~25.4% market share. This includes retail petrol, diesel, kerosene, LPG, and industrial fuels.
I forecast volume growth in line with India’s oil demand trajectory. The IEA projects India’s oil demand will grow ~1.1 million bpd (20%) from 2023 to 2030, led by diesel and jet fuel. Gasoline (petrol) growth will slow to ~0.7% annually due to EV adoption, but diesel demand (for freight, industry) remains robust – expected to account for nearly half of India’s demand increase.
Given this outlook and BPCL’s planned network expansion (e.g. adding thousands of new retail outlets), I assume BPCL’s sales volume grows ~3% p.a. for the next 5 years, then ~1% p.a. in the latter half of the decade as EVs begin to dent petrol demand. Specifically, sales rise from 52 MMT in FY2025 to ~58 MMT by FY2030, then level off around 61 MMT by FY2034.
BPCL’s aggressive retail expansion (e.g. adding 540 new outlets in H1 FY2025, targeting 23,000 total outlets) and higher throughput per outlet than peers (154 KL/month vs 137 KL for other PSUs) support its volume growth at or above industry rates in the near term.
Price Realisation: Retail fuel prices in India are deregulated for petrol and diesel, so BPCL’s realizations track international prices (import parity) in rupee terms.
I use the same Brent USD price path as for refining segment.
For each year, the average retail product price (net of taxes) is assumed proportional to Brent. For example, at Brent $70 (FY2025) and ₹85/$, the average net realisation might be ₹58652 per ton of product (or ₹60–65 per litre for petrol/diesel net of taxes, which is in line with current pump prices once you remove excise/VAT).
If Brent dips in FY2026 (which it already has), product realisations dip correspondingly (~₹55k/ton), and by FY2030 with Brent $75, realization ~₹65k/ton (assuming some inflation in marketing margins).
Do note that actual retail prices also include marketing margin and are influenced by competition and government informal intervention. In FY2022–2023, for instance, OMCs kept pump prices unchanged during a crude spike, leading to under-recoveries (losses) – BPCL took a hit especially on domestic LPG sales sold below market price, requiring a ₹72,300 crore accounting hit in one quarter.
For my base forecast, I assume no major government price freeze going forward (post-2024 election), i.e. BPCL can adjust retail prices to reflect crude costs on average, though LPG subsidies may continue (LPG under-recovery is modeled as a modest drag on margins initially).
The table below shows the BPCL’s Marketing segment forecast for volume, price, and revenue:

Note: Average net price per ton is derived from Brent (e.g. ₹58,652/ton ~ $70/bbl at 85₹/$). FY2026 shows a slight price drop with Brent fall. LPG under-recovery is embedded in the lower margin in FY2025–26 (e.g. BPCL incurred ~₹7229 Cr hit in Q3 FY2025 for LPG subsidy shortfall). I assume some government support to offset extreme losses, and by FY2027 the LPG pricing gap narrows.
EBIT Margin: Marketing (fuel retail) margins are much thinner than refining, but more stable in deregulated periods. BPCL’s marketing segment EBIT margin historically averages in the low single digits.
For petrol and diesel, the per-unit margin (before interest) is usually a few rupees per litre. I assume a normal petrol/diesel marketing margin of ~₹2.5/Litre (roughly ₹2,900 per ton). On an average product price of ~₹50–60/L (including cost), that margin is ~4–5%.
In bullish periods when crude falls and pump prices are not immediately cut, OMCs enjoy very high marketing margins (e.g. in H2 FY2023 and FY2024, BPCL’s auto-fuel margins were “healthy”, contributing to a rebound in profits).
Conversely, in FY2022–2023 when crude spiked, BPCL’s marketing margins turned negative for petrol/diesel, and combined with LPG losses it resulted in near-zero profit. For my forecast, I start with a constrained margin of ~3% in FY2025 (to reflect lingering LPG loss and slightly lower auto-fuel margin in a year of falling crude), then normalize to 5% EBIT margin by FY2027 onwards.
Five percent of sales is achievable if OMCs maintain ₹2–3/L margins on average; it’s also in line with global downstream peers – for instance, Asian fuel retail margins are typically 3–5%. I also benchmark to BPCL’s past: in “normal” years without price intervention, net profit margins were ~2–3% (which includes all segments), so a 5% EBIT margin for marketing (before corporate costs) is a fair long-term estimate.
The table below shows the Marketing segment forecast for EBIT:

Under these assumptions, marketing EBIT grows from ₹9.1k Cr in FY2025 to ~₹18,800 Cr by FY2030, roughly proportional to volume growth. This assumes a stable competitive environment – private players like Reliance/BP and Nayara are present but PSU OMCs still dominate with ~90% share, so pricing discipline is assumed.
Working-capital volatility (e.g. inventory gains/losses, timing of subsidy payments) will cause year-to-year swings in reported marketing earnings – for instance, BPCL’s Q3 FY2025 net profit was hit by LPG losses – but over the long run, I expect the segment to earn a modest positive spread, given the government’s track record of compensating extreme under-recoveries on sensitive products.
(c) Petrochemicals Segment Forecast
Volume (Production/Sales): Petrochemicals are a relatively new but growing segment for BPCL.
Currently, BPCL has a small petchem capacity (~0.33 MMTPA of propylene derivatives at Kochi). The Kochi PDPP unit ramped up to ~80% utilization in H1 FY2025, contributing modest volumes (~0.3 MMT of petrochemical products in FY2024).
BPCL’s big leap in petrochemicals will come from the Bina Refinery expansion project, which includes an integrated petrochemical complex of up to~1.8–2 MMT of feedstock producing ~3 MMTPA of petrochemical products by 2028.
BPCL management expects ~8% of its product output to be petrochemicals by FY2029.
I forecast petchem volume to stay ~0.3 MMT through FY2027, then jump to ~1.0 MMT in FY2029(partial commissioning at Bina) and reach2.5 MMT by FY2030, stabilizing around 2.9 MMT by FY2032 (near the designed capacity).
This will make BPCL a notable petrochem player, capturing domestic demand growth – note that petrochemical demand in India grows roughly in line with GDP, according to BPCL’s chairman.
Price Realization: Petrochemical products (like poly-propylene, polyethylene, aromatics etc.) have their own pricing dynamics, usually linked to naphtha or crude prices but with a premium for the value-add.
I assume an average realization of ~₹80,000 per ton in FY2025 for BPCL’s current product mix (propane derivatives), which is equivalent to ~$960/ton (in line with global propylene derivative prices). This is higher than fuel prices per ton because petrochemicals command a premium.
I then project a moderate increase at inflation or slightly above: petchem prices can be volatile, but I assume by FY2030 an average ~₹85,000/ton and by FY2034 ~₹90,000/ton, roughly tracking oil price and demand growth. In downturns, petrochemical margins can shrink due to oversupply, but given India is a net importer of many petrochemicals, BPCL should realize healthy prices for its output.
EBIT Margin: Petrochemicals typically have higher EBIT margins than fuel refining, especially when integrated (since the feedstock is produced in-house at refining cost).
Global petrochemical margins vary by product, but an EBIT margin of 10–15% is common in a balanced market. I assume BPCL’s petchem segment EBIT margin starts around 10% (the Kochi unit was reportedly adding ~$0.8/bbl to BPCL’s GRM in H1 FY2025, indicating it’s profitable).
As the Bina petrochemical project comes online, I expect efficiency and scale to improve margins to 15% by FY2030 (assuming world-scale polymer plants with competitive cost). I benchmark this to regional peers: Reliance Industries (an integrated refiner-petchem player) often had petrochem EBITDA margins ~15–20%. I stay slightly conservative given BPCL’s petrochem venture is new – 15% EBIT margin (perhaps ~20% EBITDA margin) in steady state. This also factors that BPCL’s petrochem output will partially diversify (some commodity polymers, maybe specialty grades), smoothing margins.
Forecast for Petrochemicals segment:

Despite being the smallest segment currently, petrochemicals become a significant value contributor by 2030, with EBIT growing to ~₹3,200+ Cr (about 10% of total EBIT by then). Notably, petrochemicals can smooth out refining cycles – during periods of low fuel cracks, petchem margins might hold if petrochemical demand is strong (and vice-versa).
I assume a balanced scenario without major petchem down-cycle; a global oversupply in polymers could reduce our price and margin assumptions. The integration of refining and petchem at Bina means some “transfer” of intermediate streams; in our model I account for all petchem revenue and profits in this segment (with the refining segment effectively treating petchem feed as sold internally at cost).
(d) Green Energy Segment Forecast
Volume/Capacity: BPCL is venturing into green energy as part of its 2040 net-zero goal. This includes renewable power (solar, wind), biofuels, and emerging areas like green hydrogen and EV charging infrastructure.
While currently a negligible part of revenue, BPCL has announced an ambitious renewable push: ₹10,000 Cr capex over FY2025–26 for renewables alone, aiming for 10 GW of renewable capacity by 2040.
I assume BPCL commissions ~1.3 GW of renewable capacity by FY2027 with that initial capex (utility-scale solar/wind, possibly via JV or standalone projects). I then assume continued investments to reach ~3 GW by FY2034.
For volume, I use electricity generation (GWh) as the output metric. For example, 1 GW at 25% capacity factor yields ~2,190 GWh/year. BPCL’s renewables output could thus rise from near zero in FY2024 to ~2,000 GWh in FY2026 (as ~0.6 GW comes online) and further to ~6,000–7,000 GWh by FY2034 (with ~3 GW running).
Price Realization: I assume BPCL sells renewable electricity at an average tariff of ₹3.5 per kWh (₹3.5/unit) initially, trending to ₹4 by 2030 (as newer projects might mix solar, wind, possibly green hydrogen off-take, etc.).
This is consistent with current solar PPAs i.e. power purchase agreements in India (~₹2.5–3/unit) plus potential higher tariffs for round-the-clock renewable or green hydrogen contracts in the future. For EV charging, BPCL’s revenue per kWh delivered might be higher (retail rates), but that will be a very small component relative to bulk power generation – we include it qualitatively.
EBIT Margin: Renewable power generation has a high EBITDA margin (70-80%) but significant depreciation. EBIT margins are typically ~30-40% for solar/wind projects. Given BPCL’s green ventures are likely in early build-up, I assume initial negative EBIT (expenses in setup) but by FY2030+ the projects yield stable cash flows. I model EBIT margin of ~30% once projects stabilize (supported by low operating cost of solar/wind). For green hydrogen, if BPCL ventures into production, early years might not be profitable, but I consider that part of future growth beyond our 10-year horizon or subsidized by government incentives (so I exclude any speculative hydrogen revenues for now).
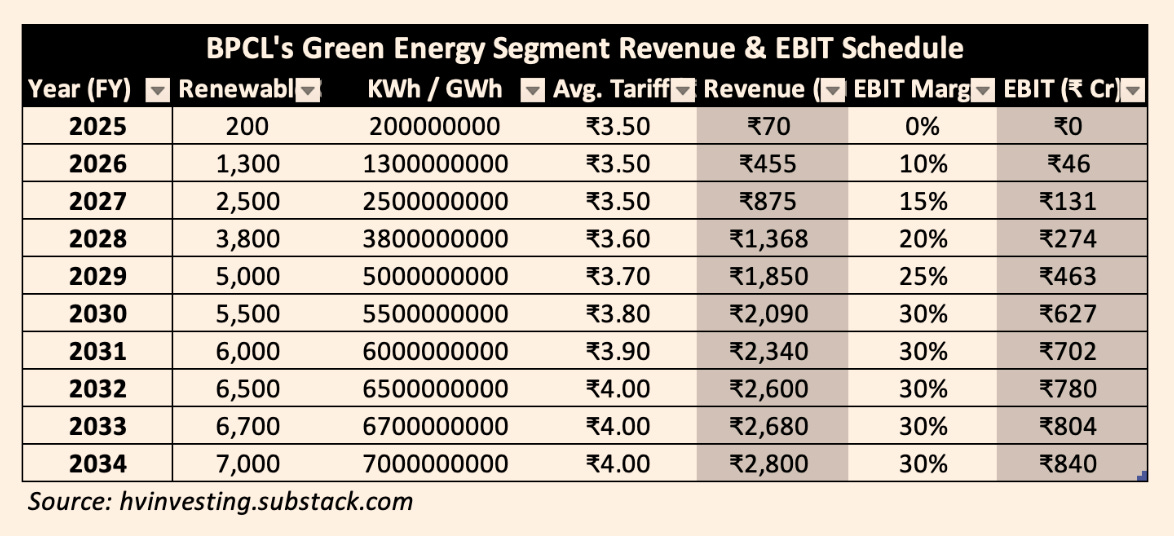
Even by FY2034, Green segment revenue (~₹2,800 Cr) is a small fraction of BPCL’s total. However, it has strategic importance: it future-proofs BPCL as an energy company beyond petroleum. It also provides optionality in valuation – for example, successful green hydrogen commercialization or an EV charging network could unlock higher growth or subsidies not fully captured in this conservative forecast.
Qualitatively, BPCL’s investments in EV charging infrastructure (it is setting up fast chargers at retail outlets) and biofuels (ethanol, biogas) support its marketing business resilience as fossil fuel demand eventually plateaus.
I consider these qualitative upsides in Part 4, but they are not explicitly monetized in our base financials beyond the modest renewables revenue shown.
Summary of Part 1: In aggregate, BPCL’s revenue is forecast to grow modestly over the next 10 years (the high rupee turnover of fuel sales grows ~3-4% CAGR, largely tracking inflation/price).
By FY2030, the revenue mix shifts slightly: refining and marketing still contribute ~95% of revenue, but petrochemicals could contribute ~5% and green energy ~1%. EBIT margins overall are projected to improve from the very thin levels of FY2023–25 to a more robust level by FY2030 as conditions normalize – driven by refining margin normalization, stable marketing margins, and higher-margin petrochemicals.
My forecast long-term consolidated EBIT margin (blended) is around 6–7% by FY2030 (roughly summing segment EBITs over total revenue), which is consistent with BPCL’s improved profitability in stable periods (for instance, BPCL’s net profit margin reached ~5.8% in FY2022 when there were no price controls).
I will examine if these margins translate to returns above the cost of capital in Part 2 and Part 3.
Download BPCL’s Excel model of revenue and EBIT schedules below: